
Our collection of resources based on what we have learned on the ground
Resources
infographic
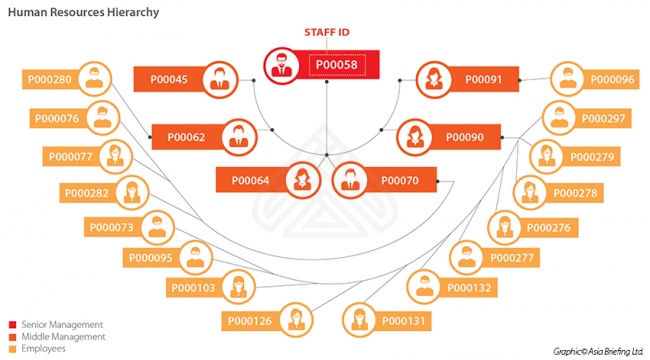
The Human Resources Hierarchy
- April 2017
- Members Access
This infographic explains how the hierarchy structure works in human resources from senior management and finally to basic employee level.
infographic
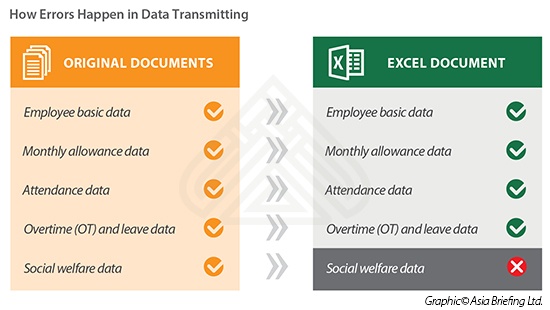
How Errors Happen in Data Transmitting
- April 2017
- Free Access
This infographic shows some of the errors which could happen when transferring original documents to an excel sheet including employee basic data, monthly allowance data, attendance data, etc.
infographic
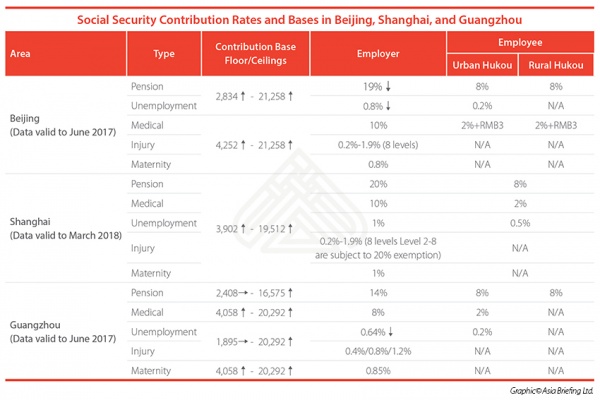
Social Security Contribution Rates and Bases in Beijing, Shanghai, and Guangzhou
- April 2017
- Members Access
This table shows the social security contribution rates in Beijing, Shanghai, and Guangzhou.
infographic
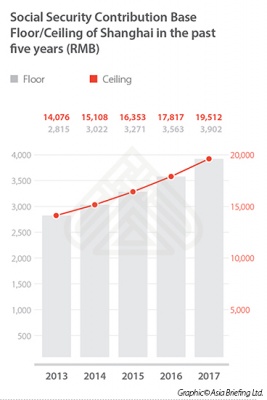
Social Security Contribution Base Floor/Ceiling of Shanghai in the Past Five Yea...
- April 2017
- Members Access
This bar chart shows how the contribution base floor and ceiling of Shanghai has changed from 2013 to 2017.
infographic
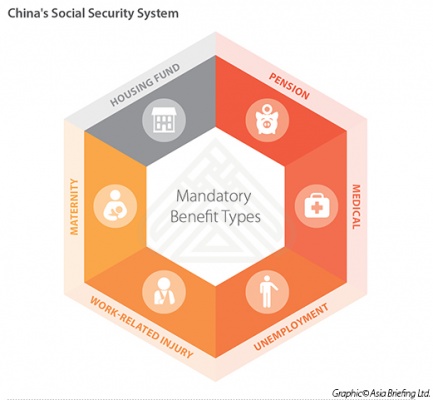
China's Social Security System
- April 2017
- Free Access
This infographic shows the mandatory benefits types in China's Social Security System, including housing fund, pension, medical, maternity, unemployment and work-related injury insurance.
infographic
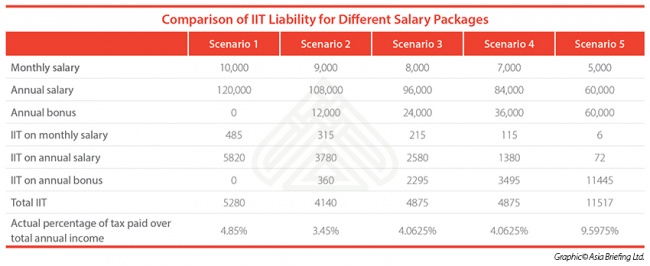
Comparison of IIT Liability for Different Salary Packages
- April 2017
- Members Access
This infographic shows how IIT liability varies depending on the monthly or annual salary and annual bonus.
infographic
Taxable Income of Foreign Individuals

- April 2017
- Free Access
The infographic above explains the income sourced within China from less than 90 days starting from income sourced within China
infographic
Monthly Taxable Income: Chinese and Foreign Nationals

- April 2017
- Free Access
This table and the descriptions presents the tax income of both Chinese and Foreign Nationals that involves based Salary, fringe benefits, Mandatory Social Security contribution, and Deductible allowances.
infographic
ASEAN Trade Flows

- March 2017
- Members Access
This infographic represents ASEAN trade flows (US$ billion), with a focus on Europe and the U.S.
infographic
General Information on Brunei

- March 2017
- Free Access
This table gives a general overview on Brunei, giving information such as the population, GDP, import value, export value, and average monthly wage.
infographic
General Steps for Setting up a Business in Brunei

- March 2017
- Members Access
This infographic shows in details what are the steps for setting up a business in Brunei, listing the procedures and the time necessary to complete each of them.
infographic
General Information on Cambodia

- March 2017
- Free Access
This table shows general information on Cambodia, such as its population, GDP, import and export value, and average monthly wage.
Enquire for more information about our services, and how we can help solve challenges for your organization
Contact UsOur Clients
Discover our esteemed global clients across diverse sectors. We believe in providing our clients with exceptional service and a commitment to being their partner for growth in Asia.
See what our clients say about us


